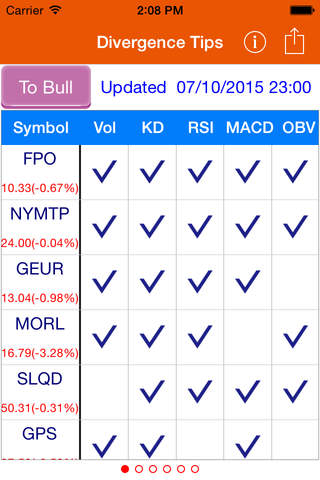
Divergence Tips - USA Stocks app for iPhone and iPad
Developer: Fonestock Technology Inc.
First release : 03 Mar 2015
App size: 4.98 Mb
What is Divergence?
Divergence is a leading indicator that uses price and quantity to predict future trends. By observing divergences, investors can avoid substantial loses or missing the train, when there is a major shift in pricing direction. This kind of change is important to value investors, trend traders, and short term traders as well.
When the price is on the rise and has a new peak, but the technical indicator at the relative point does not get high at all, there is a divergence. This kind of divergence is called “negative divergence”. It means that the buying power is not strong enough, and there is a pressure on the price. The price may even reverse. Since this is the signal to be watched for in a bullish trend, we call it “Divert to Bear”. However, it does not necessarily mean that the trend will turn bear right after.
On the other hand, when the price of a stock keeps dropping, but the corresponding indicators do not, it means that the stock price may be at the bottom and may bounce back. This kind of divergence is called “positive divergence” or “Divert to Bull”.
A Reminder
Divergence is often an indicator for trend reversal, but not always. In a strong upward trend, divergences may happen two or more times for the same indicator before there is a trend reversal. Therefore, you need to take into consideration other factors; such as, if it is at the beginning of a strong trend, and the divergence is just a resting point. This could be indicated by a recent golden cross of KD, a high positive value of MACD, etc.
More importantly, you should always have an action plan and risk management scheme before you actually place an order. You also should have stop loss point to protect your profit.
Why do I Use Divergence Tips?
Are you still checking thousands of candlestick charts and technical indicators to see if there are divergences with your own eyes? You don’t have to any more. Divergence Tips will do that for you now!
Divergence Tips is the first ever APP that provides stock information on “Divert to Bull” and “Divert to Bear”.
Using the latest cloud technology and big data analysis, Divergence Tips provides:
‧ Active notification to investors after the end of trading day.
‧ Stocks with divergences and corresponding technical indexes.
‧ Common divergence indicators: Volume, Stochastic Oscillator KD, DIF-MACD value in MACD index, RSI indicator, and OBV indicator.
‧ One step tapping to see the candlestick charts and corresponding technical indicators of the stock.
‧ A quick and accurate way of picking up potential trend reversal stocks.
For instance, if there is an MACD divergence in “Divert to Bull”, and the MACD < 0, and there is a golden cross for DIF and MACD, this may be a valid bottom signal. In addition if the divergence is followed by a big bull (a big positive candlestick) or three bulls pattern, it may be a good time to buy.
When you are familiar with the usage of divergence, you will want to watch carefully the subsequent development of the pricing. It would be a good practice to combine the divergence alert with the candlestick patterns for the turning point of pricing trend.
In this case, you are welcome to try out the more advanced trading system: Pattern Trader.
FoneStock wishes you success in stock investment!

